Scleroderma Program
A partnership to treat, study and cure scleroderma.
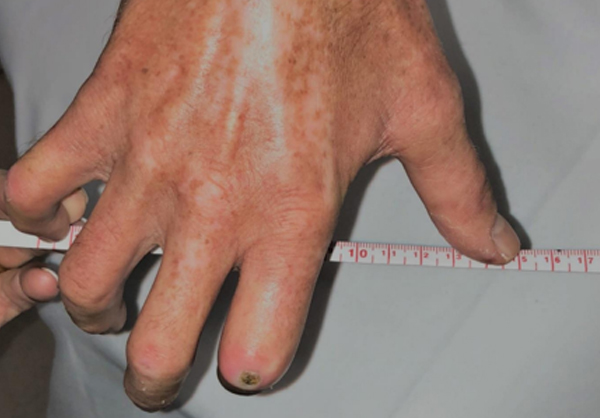
It often begins with cold hands—fingers turn white or blue and become numb or tingly on exposure to cold. Months or years later, the skin thickens and hardens due to an excessive buildup of scar tissue. About 100,000 people in the United States suffer from scleroderma (also called systemic sclerosis). In the more serious form of this disease, this scar tissue can involve the internal organs leading to potentially life-threatening complications.
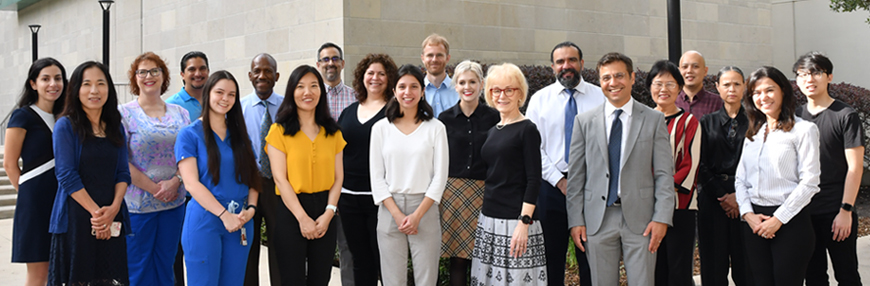
The Scleroderma Program at McGovern Medical School at UTHealth Houston is a patient-centered program to treat and study this multifaceted disease, established in 1998. Led by Maureen D. Mayes, MD, MPH, Shervin Assassi, MD, MS, and Zsuzsanna H. McMahan, MD, MHS this program is one of the largest clinical and research centers in the world specializing in scleroderma. Our multidisciplinary team includes rheumatologists, translational scientists, biostatisticians, clinical staff, and study coordinators. We also work closely with pulmonologists, cardiologists, dermatologists, and gastroenterologists at UTHealth Houston who have extensive experience in treating persons with scleroderma.
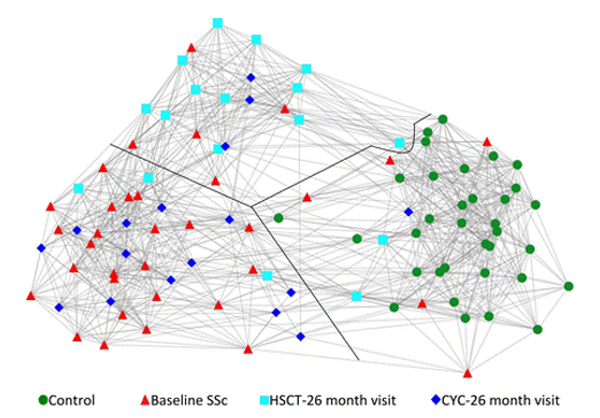
To accelerate our understanding of disease biology and the development of more effective treatments, we use cutting-edge molecular techniques to elucidate the cellular and molecular events leading to Scleroderma. Moreover, we participate in clinical trials that aim at improving clinical management and quality of life for our patients.
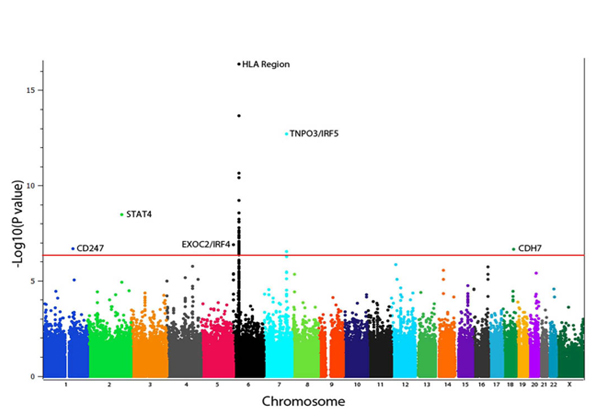
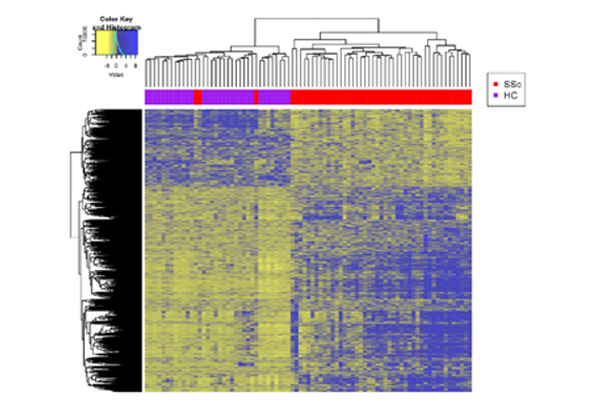
Dr. Mayes established the Scleroderma Family Registry and DNA Repository in 1998. Since then, it has collected samples from more than 3,500 patients with scleroderma, becoming the largest registry/repository of its kind in the United States. Through the Registry and the Genes versus Environment in Scleroderma Outcome Study (GENISOS) observational cohort, the Scleroderma Program has discovered more than 30 disease-associated gene variants and several molecular profiles at the blood and skin tissue levels that can help understand the cause of disease and develop better treatments.