This document requires Netscape 3.x or compatible Web Browser.


UT Bullet Biostatistics for the Clinician

Biostatistics for the Clinician

UT Logo

University of Texas-Houston
Health Science Center

Lesson 3.0

Review of Lesson 2

Lesson 3: Clinical Decision Making in a Multivariable Environment 3.0 - 1 UT Bullet

UT Bullet Biostatistics for the Clinician

3.0 Review of Lesson 2

3.0.1 Achieving Appropriate Power

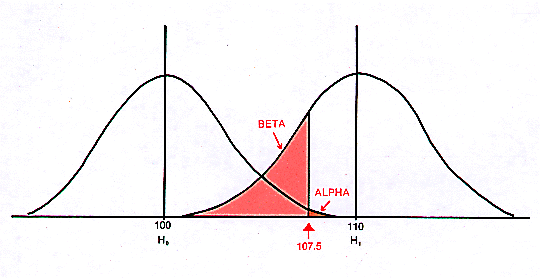
Let's consider the sampling distribution curves that you saw in Lesson 2 again (See Figure 3.3 below).

Figure 3.3: Alpha and Beta Errors
Alpha & Beta Errors

The primary point of the following is to review the issues you need to address in order make sure you get appropriate statistical power in an experiment. The curves in the figure represent sampling distributions of means. That means each curve represents a distribution of mean values obtained from samples of a given size. As an example, if you look at the point under the left curve labeled 100, what you see graphed on the vertical axis is the proportion of all samples of the given size that have a sample mean of 100. The curve also shows that when you graph the means of these samples that the means are spread out in a nearly normal distribution. Let's say the sampling distribution on the left represents that for the null hypothesis for your research.

So, if the null hypothesis were true, that is the curve on the left represents reality, then the expectation would be that if you were to sample people in groups of size 10 or 20 or 30 or whatever size you are using, you would find sample mean values that lie in various places in the central part, that were way out on the left, that were way out on the right, and so on. The graph just shows the kind of variability you would expect in sample means. Even though the population mean is about 100, (let's say IQ's are graphed), you could still expect to find some groups having sample means in the left or right tails of the distribution.

Review of Lesson 2
Practice
Exercise 1:
What entities are being graphed in Figure 3.3:

No Response
Scores from samples
Means of samples
Standard deviations
Standard errors


Lesson 3: Clinical Decision Making in a Multivariable Environment 3.0 - 2 UT Bullet

UT Bullet Biostatistics for the Clinician
Assume, the curve on the right in Figure 3.3 above represents your research hypothesis for the sampling distribution of the population you think the group comes from. You'd be saying, "I don't believe this group that I'm going to measure really comes from the average population. I think they're smarter than the average." The point is that in order to decide how to do the experiment, you have to decide how small of a difference (called the effect size) in the two curves' means is clinically significant. If the smallest difference that is important (clinically significant) is 10, you set up a larger beta error (and so have less power = 1 - beta) than if you decide that the smallest important difference is 20.

You can see how, by a doing a little further thinking about the curves. Lets assume that the population mean IQ for the right curve is 110. Suppose you take a sample and find the sample mean is not 100 but 107.5. The questions are, "What is the chance of your being really from a group with an average IQ of 100?", and conversely, "What's the chance of your really being from a group with an average IQ of 110?"

By looking at the curves you can see that there is a small chance (the area under the left curve to the right of 107.5) of obtaining a sample mean as big as 107.5 if the sample mean is from the left distribution. But, there's much more of a chance (the area under the right curve to the right of 107.5) that the sample mean came from the right distribution. So, you could say the chance that the sample came from the population represented by the curve on the left is small, say less than .02 or .05, depending on the area.

The fact is the sample mean of 107.5 could also be from the distribution on the right, but you have a chance of the experiment not detecting that depending upon the beta error. Remember the beta error is the probability of a false negative -- that the experiment doesn't show the sample mean is from the the curve on the right when it really is.

Now, consider what happens if you move the right curve to the right, representing what happens if the difference in the means is larger than 10. Of course, the curve on the left stays the same. But, the right curve slides to the right. You can see that as the right curve moves to the right, less of it lies to the left of 107.5. In other words, you reduce your beta error. You reduce your chance of concluding the sample is not from the right distribution when in fact it is.

Remember, the area to the right of 107.5 under the right curve is 1 - beta and it represents power -- the probability that you will detect the difference or the effect. Because the beta area decreases for the experiment as you move the curve to the right, the power increases.

Review of Lesson 2
Practice
Exercise 2:
As you increase the difference (effect size) in the means hypothesized by the null and research hypotheses you:

No Response
Increase beta
Increase alpha
Increase power
None of the above


Lesson 3: Clinical Decision Making in a Multivariable Environment 3.0 - 3 UT Bullet

UT Bullet Biostatistics for the Clinician

3.0.2 Working with a Statistician

To carry out a research study you, the physician, must make an important decision. You decide how far apart these two distributions need to be for it to be clinically important. You decide the minimal clinically significant effect size. Typically you will want to have an effect in a medical experiment that is somewhere on the order of 25%, 50% or 75%. You usually look for big effects, so that the effects are not only statistically significant, but clinically significant. You might use a rule of thumb that you're not interested in anything less than a 50% improvement compared to a placebo or control treatment.

So, you would tell the statistician what size mean difference or effect size you want to be able to detect. You make that determination for the statistician. Then, the statistician makes an estimate concerning the shape of the curve. Sometimes it's in the literature. If you're doing things like blood pressure where there's a considerable body of research, you can go to the literature and find out what the curve looks like.

Review of Lesson 2
Practice
Exercise 3:
Who determines the smallest effect size that is clinically significant?

No Response
Statistician
Physician
Patient
Administrator


Lesson 3: Clinical Decision Making in a Multivariable Environment 3.0 - 4 UT Bullet

UT Bullet Biostatistics for the Clinician

Now, the statistician also needs to know something about the shape of the curve to determine an appropriate sample size to detect the effect. The chances of detecting the effect depend not only on how far apart the curves are, but on the standard error, how wide the curve is. When you increase the sample size you make the curves skinnier, that is you decrease the standard error. Again, by examining Figure 3.3 you can see that if the curve on the right is skinnier, then the part of it to the left of 107.5 would also be smaller (beta), so, increasing the sample size to make the curve skinnier has an effect on beta and power, similar to moving the curve to the right.

So, you go to the statistician with the following requirements:

  • You specify the minimum clinically significant effect size.
  • You identify what level of alpha or Type I error you are willing to tolerate.
  • You tell the statistician you want an 80% chance in an experiment like this of detecting a result of the size you have specified.
  • And, you take the statistician to the literature and help figure out what the distribution might look like, particularly concerning standard deviation or standard error.
The statistician will then tell you how many experimental subjects you need.

So, you need to be intimately involved in the design of the experiment if the statistician is going to help you arrive at the objectives you seek. The statistician doesn't have a clue with regard to what constitutes a clinically significant effect. It is of the utmost importance therefore, that you collaborate with the statistician from the beginning to make sure that you don't waste time and resources with a poorly conceived and designed study.

Review of Lesson 2
Practice
Exercise 4:
You tell the statistician the :

No Response
Effect size
Power
Alpha
All except "No Response"


Lesson 3: Clinical Decision Making in a Multivariable Environment 3.0 - 5 UT Bullet

UT Bullet Biostatistics for the Clinician

3.0.3 Confidence Intervals

Now, besides looking at alpha and beta errors the way you have so far, you can also look at variability in kind of the reverse picture. Let's say that you have a treatment group and you measure the impact of a particular treatment. Suppose you get a treatment group mean of 107.5, and folks ask you, "How accurate is that mean?" In other words how accurate is the sample mean as an estimate of the mean of the population that it came from (see Figure 3.6 below).

Figure 3.6: Confidence Interval Related to:
Sample and Population Means
Confidence Interval

Now, examining the figure, it is possible that the sample mean of 107.5 could come from the distribution on the left where people have a mean of 101.6. But, according to the figure the chances are only 2.5% that it comes from the left distribution. On the other hand, the chances are also only 2.5% that it comes from the distribution on the right where the mean is 113.4.

Therefore the probability that it came from either of the two distributions is only 5%, while it must also be that the chances are 95% that it comes from a distribution with a mean somewhere between the two, in other words, somewhere between 101.6 and 113.4. Another way to say this is that the sample mean of 107.5 has a 95% confidence interval extending from 101.6 to 113.4. That means the chances are only 5 out of 100 that the sample mean of 107.5 came from a population with a mean lower than 101.6 or higher than 113.4. You can confidently say, with a probability of 95% of being right, that the mean value of the distribution from which the sample came is somewhere between 101.6 and 113.4.

So confidence intervals can be thought of as kind of a flip side of alpha levels. They are often used when you want a measure of the precision of some sample statistic. With a confidence interval, you define with 95% or 99% confidence, the upper and lower limits of the mean value of the distribution from which the sample came.

Review of Lesson 2
Practice
Exercise 5:
The characteristic of a sample mean quantified by its confidence interval is the sample mean's:

No Response
Variability
Size
Precision
Effect size


Final Instructions

Press Button below for your score.

  • After completing Lesson 3.0, including all practice exercises, press the "Submit... " button below for Lesson 3.0 research participation credit.
  • After you press "Submit..." it is possible Netscape may tell you it is unable to connect because of unusually high system demands. If you receive no error message upon submission you're OK. But, if Netscape gives you an error message after you press the "Submit..." button, wait a moment and resubmit or consult the attendant.
  • Finally, press the "Table of Contents..." button below to correctly end Lesson 3.0 and return to the Lesson 3 Table of Contents so you may continue with Lesson 3.1.

End Lesson 3.0
Review of Lesson 2


Lesson 1: Summary Measures of Data 3.0 - 6 UT Bullet